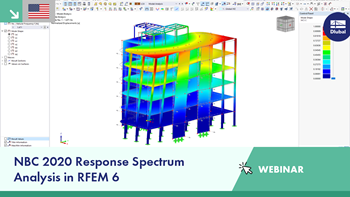
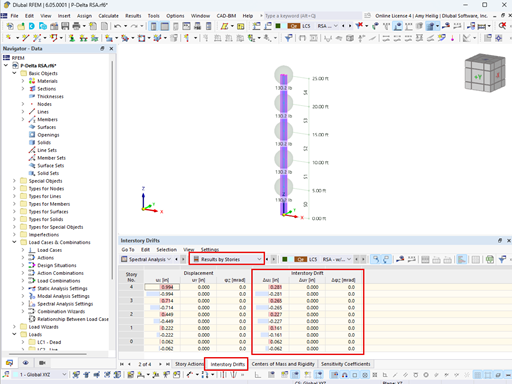
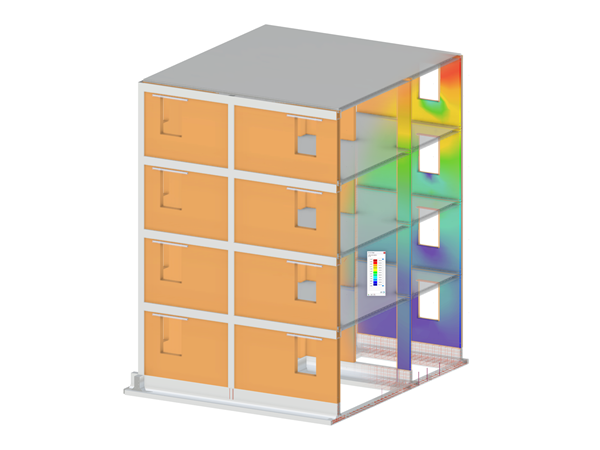
For a response spectrum analysis of building models, you can display the sensitivity coefficients for the horizontal directions by story.
These key figures allow you to interpret the sensitivity to stability effects.
For a response spectrum analysis of building models, you can display the sensitivity coefficients for the horizontal directions by story.
These key figures allow you to interpret the sensitivity to stability effects.

For a response spectrum analysis of building models, you can display the sensitivity coefficients for the horizontal directions by story.
These key figures allow you to interpret the sensitivity to stability effects.

In RFEM and RSTAB, you can visualize the flow field quantities of pressure, velocity, turbulence kinetic energy, and turbulence dissipation rate for the wind simulation.
The clipping planes are aligned with the respective wind direction.

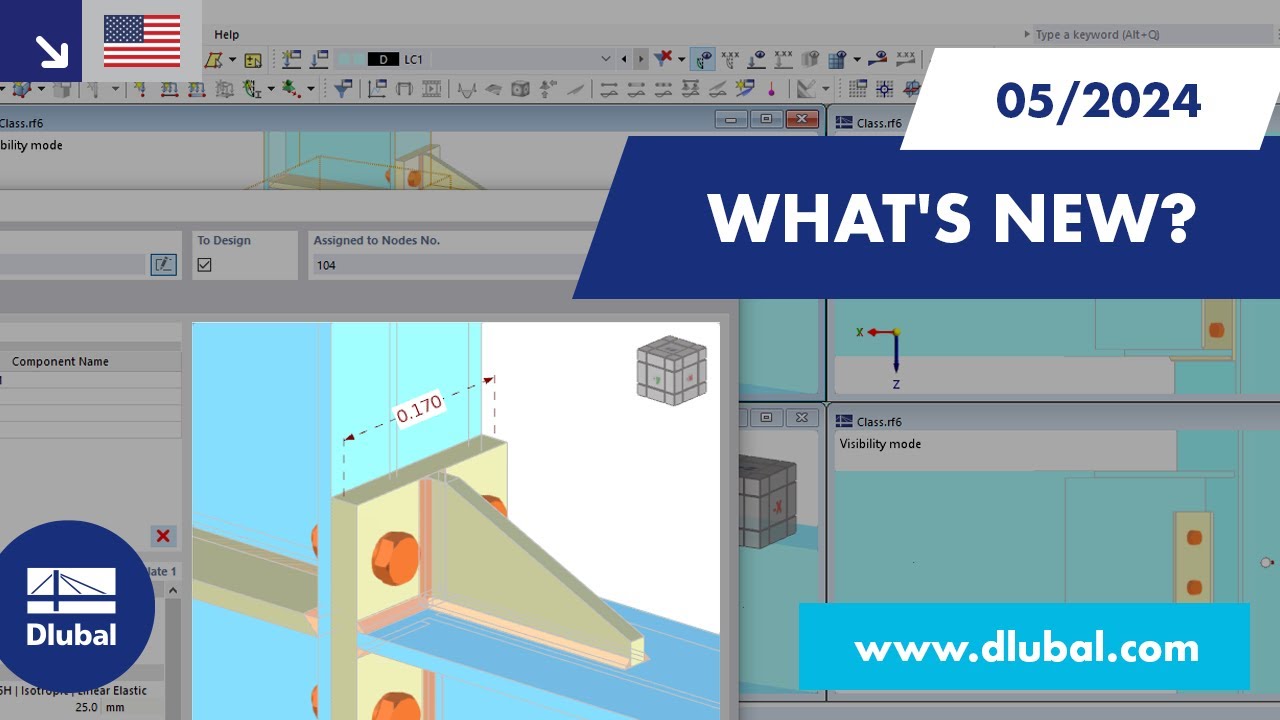
In the ultimate configuration of the steel joint design, you have the option to modify the limit plastic strain for welds.

Using the "Base Plate" component, you can design base plate connections with cast-in anchors. In addition to plates and welds, the design analyzes the anchorage and the steel-concrete interaction.

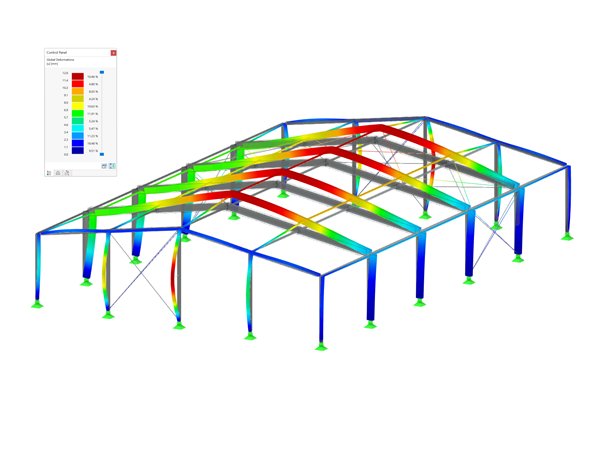
The new generation of 3D FEA software is used for the structural analysis of members, surfaces, and solids.

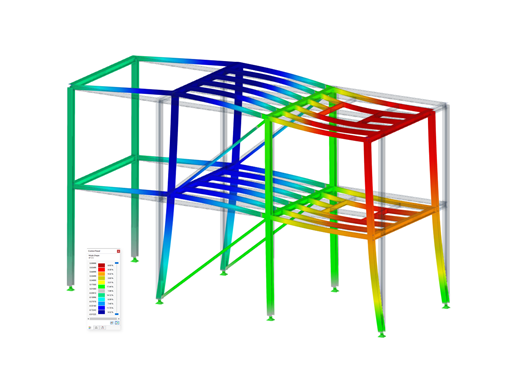
The Modal Analysis add-on allows for the calculation of eigenvalues, natural frequencies, and natural periods for member, surface, and solid models.

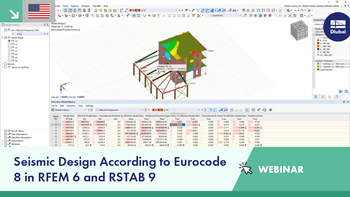
The Response Spectrum Analysis add-on performs seismic analysis using multi-modal response spectrum analysis. The spectra required for this can be created in compliance with the standards or can be user-defined. The equivalent static forces are generated from them. The add-on includes an extensive library of accelerograms from seismic zones that can be used to generate the response spectra.
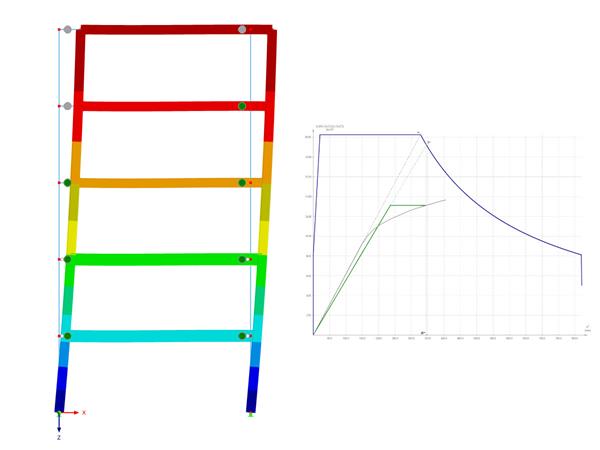
Using the Pushover Analysis add-on, you can analyze the seismic actions on a particular building, and thus assess whether the building can withstand an earthquake.
The Time-Dependent Analysis (TDA) add-on allows you to consider the time-dependent material behavior of members. The long-term effects, such as creep, shrinkage, and aging, can influence the distribution of internal forces, depending on the structure.

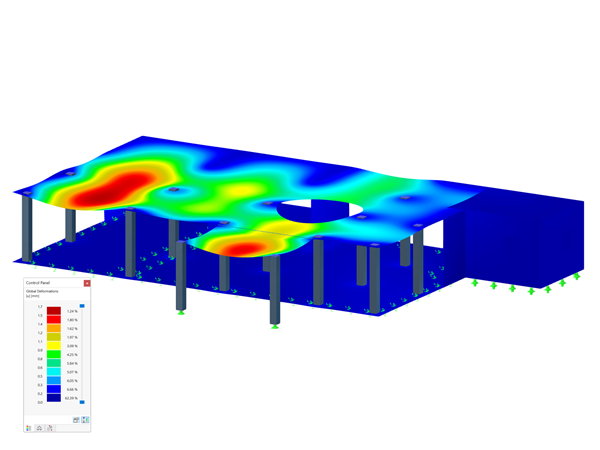
The Concrete Design add-on allows for various design checks according to international standards. You can design members, surfaces, and columns, as well as perform punching and deformation analyses.
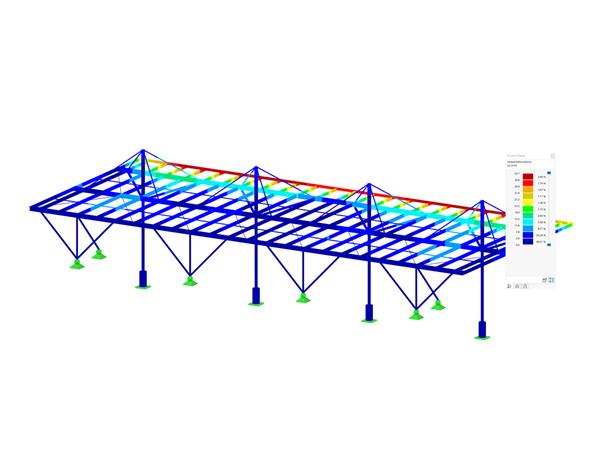
The Steel Design add-on performs the ultimate and serviceability limit state design checks of steel members according to various standards.
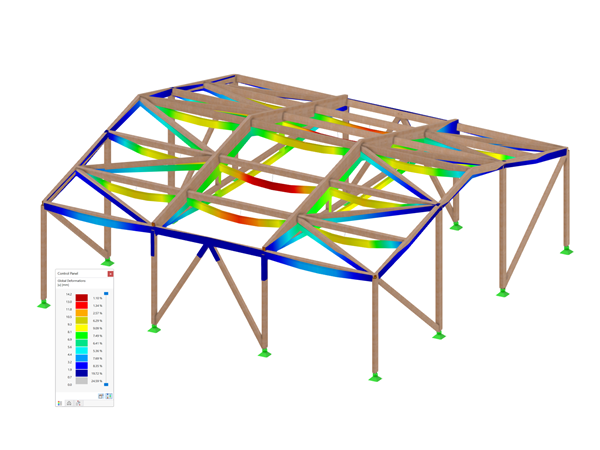
The Timber Design add-on performs the ultimate, serviceability, and fire resistance limit state design checks of timber members according to various standards.
The Masonry Design add-on for RFEM allows you to design masonry using the finite element method. It was developed as part of the research project titled DDMaS – Digitizing the Design of Masonry Structures. The material model represents the nonlinear behavior of the brick-mortar combination in the form of macro-modeling.
The Aluminum Design add-on performs the ultimate and serviceability limit state design checks of aluminum members according to various standards.

The modern 3D structural analysis and design program is suitable for the structural and dynamic analysis of beam structures as well as the design of concrete, steel, timber, and other materials.
The Modal Analysis add-on allows for the calculation of eigenvalues, natural frequencies, and natural periods for member, surface, and solid models.
The Response Spectrum Analysis add-on performs seismic analysis using the multi-modal response spectrum analysis. The spectra required for this can be created in compliance with the standards or can be user-defined. The equivalent static forces are generated from them. The add-on includes an extensive library of accelerograms from seismic zones that can be used to generate response spectra.
Earthquakes may have a significant impact on the deformation behavior of buildings. A pushover analysis allows you to analyze the deformation behavior of buildings and compare them with seismic actions. Using the Pushover Analysis add-on, you can analyze the seismic actions on a particular building, and thus assess whether the building can withstand the earthquake.
Concrete Design add-on allows for various design checks of members and columns according to international standards.
The Steel Design add-on performs the ultimate and serviceability limit state design checks of steel members according to various standards.
The Timber Design add-on performs the ultimate, serviceability, and fire resistance limit state design checks of timber members according to various standards.
The Aluminum Design add-on performs the ultimate and serviceability limit state design checks of aluminum members according to various standards.